INpulse One · ECG line
Electrocardiography
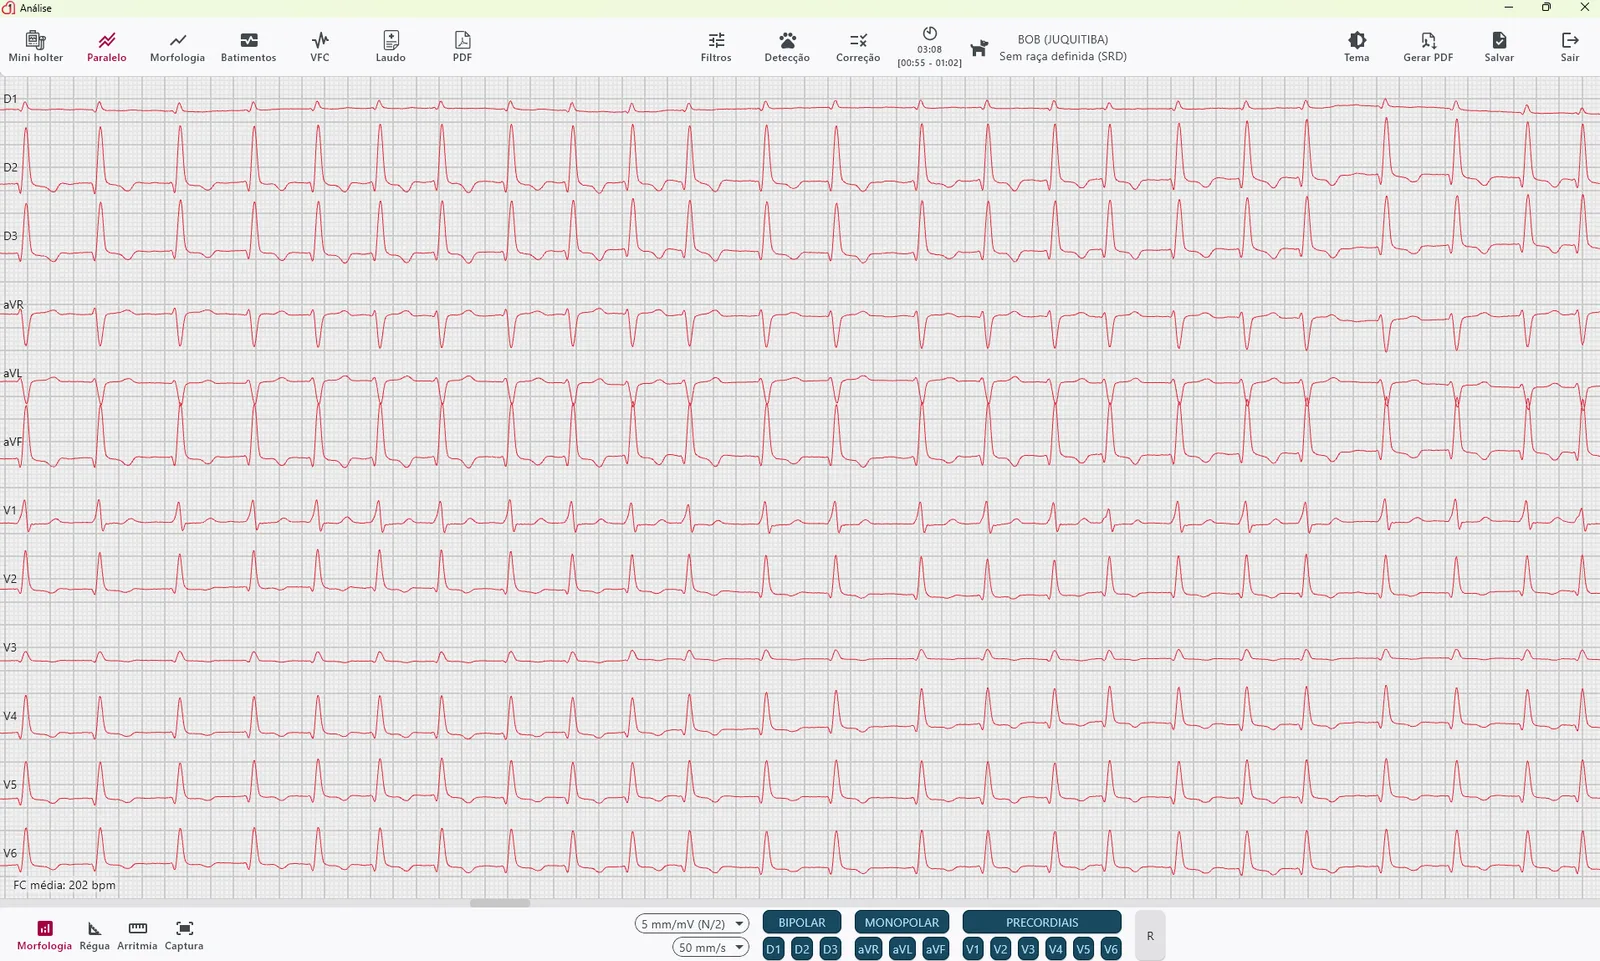
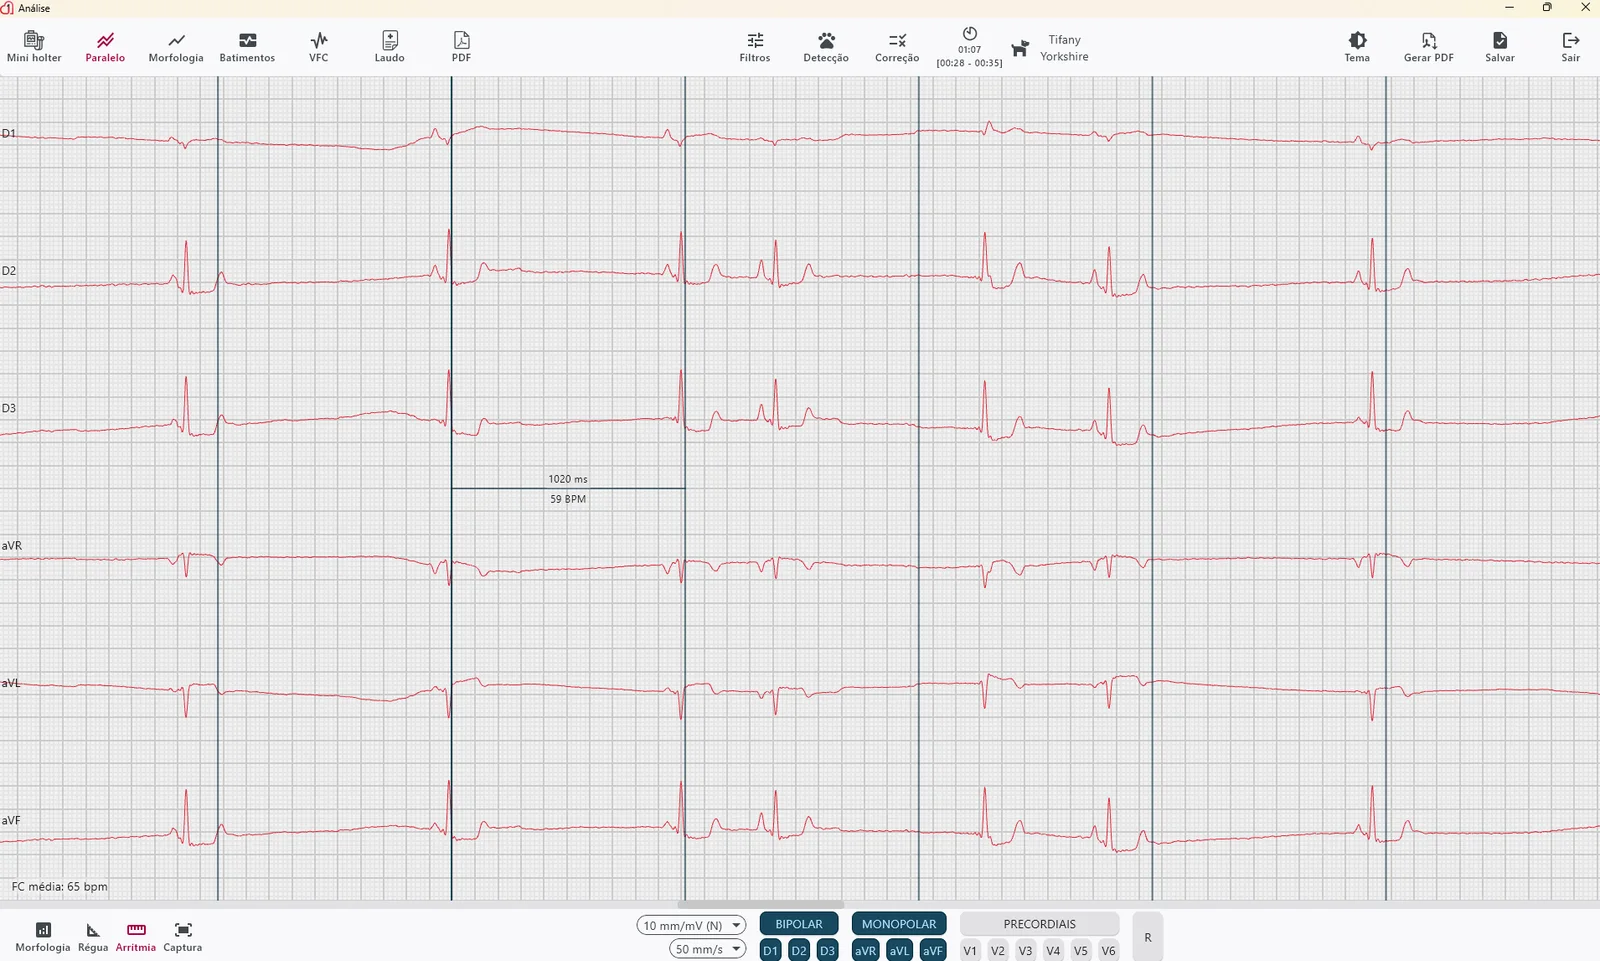
From recording to analysis: simultaneous leads, morphology and axis, HRV analysis, continuous tracing and PDF report, with the exam saved in INcloud and ready for tele-reporting.
Analysis✕
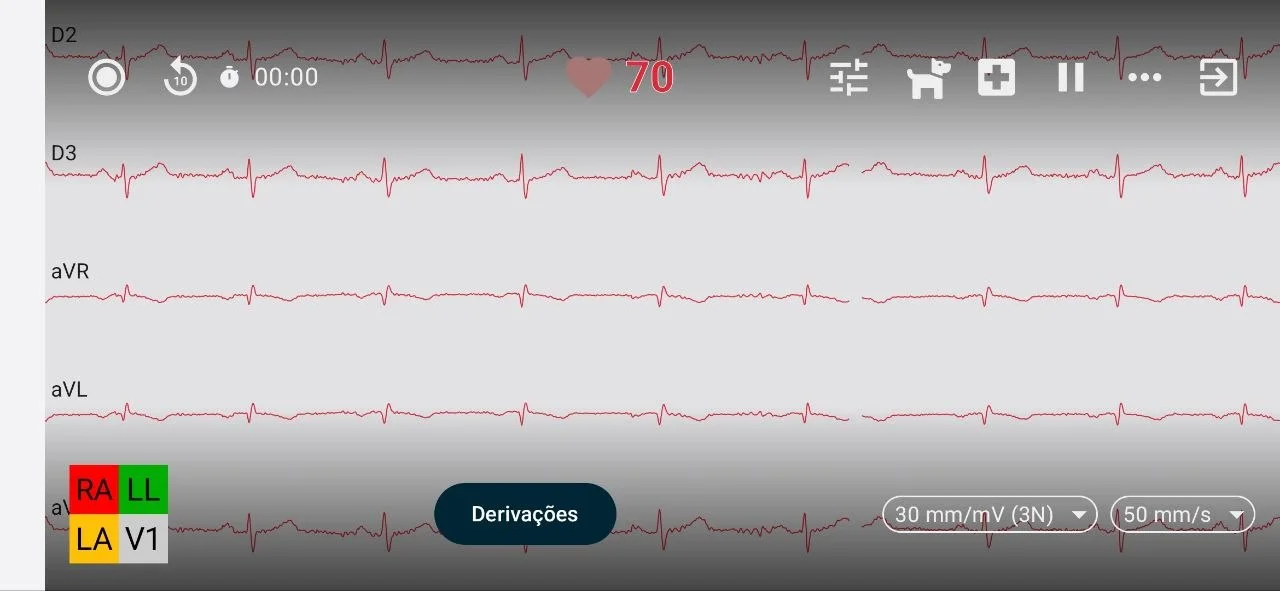
D1D2D3aVRaVLaVFV1V2V3V4V5V6
Avg HR: 202 bpm Morphology
Ruler
Arrhythmia
Capture
5 mm/mV (N/2)
50 mm/s
BIPOLARD1D2D3
MONOPOLARaVRaVLaVF
PRECORDIAISV1V2V3V4V5V6
R Real INpulse One screens · demo data
What the ECG line delivers
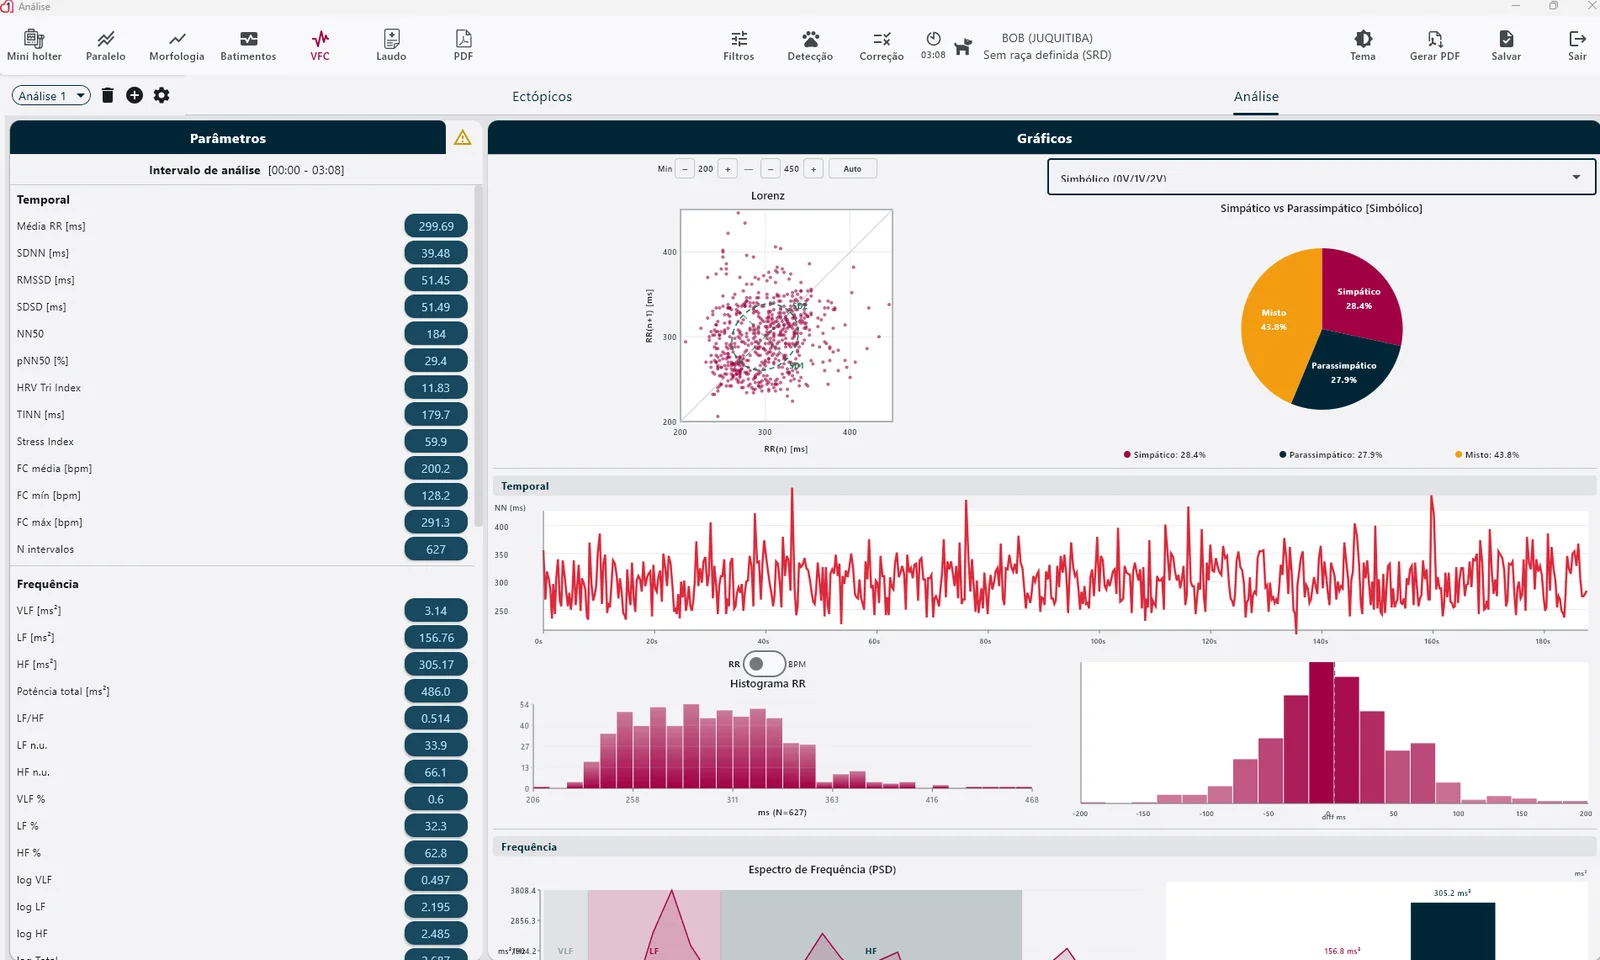
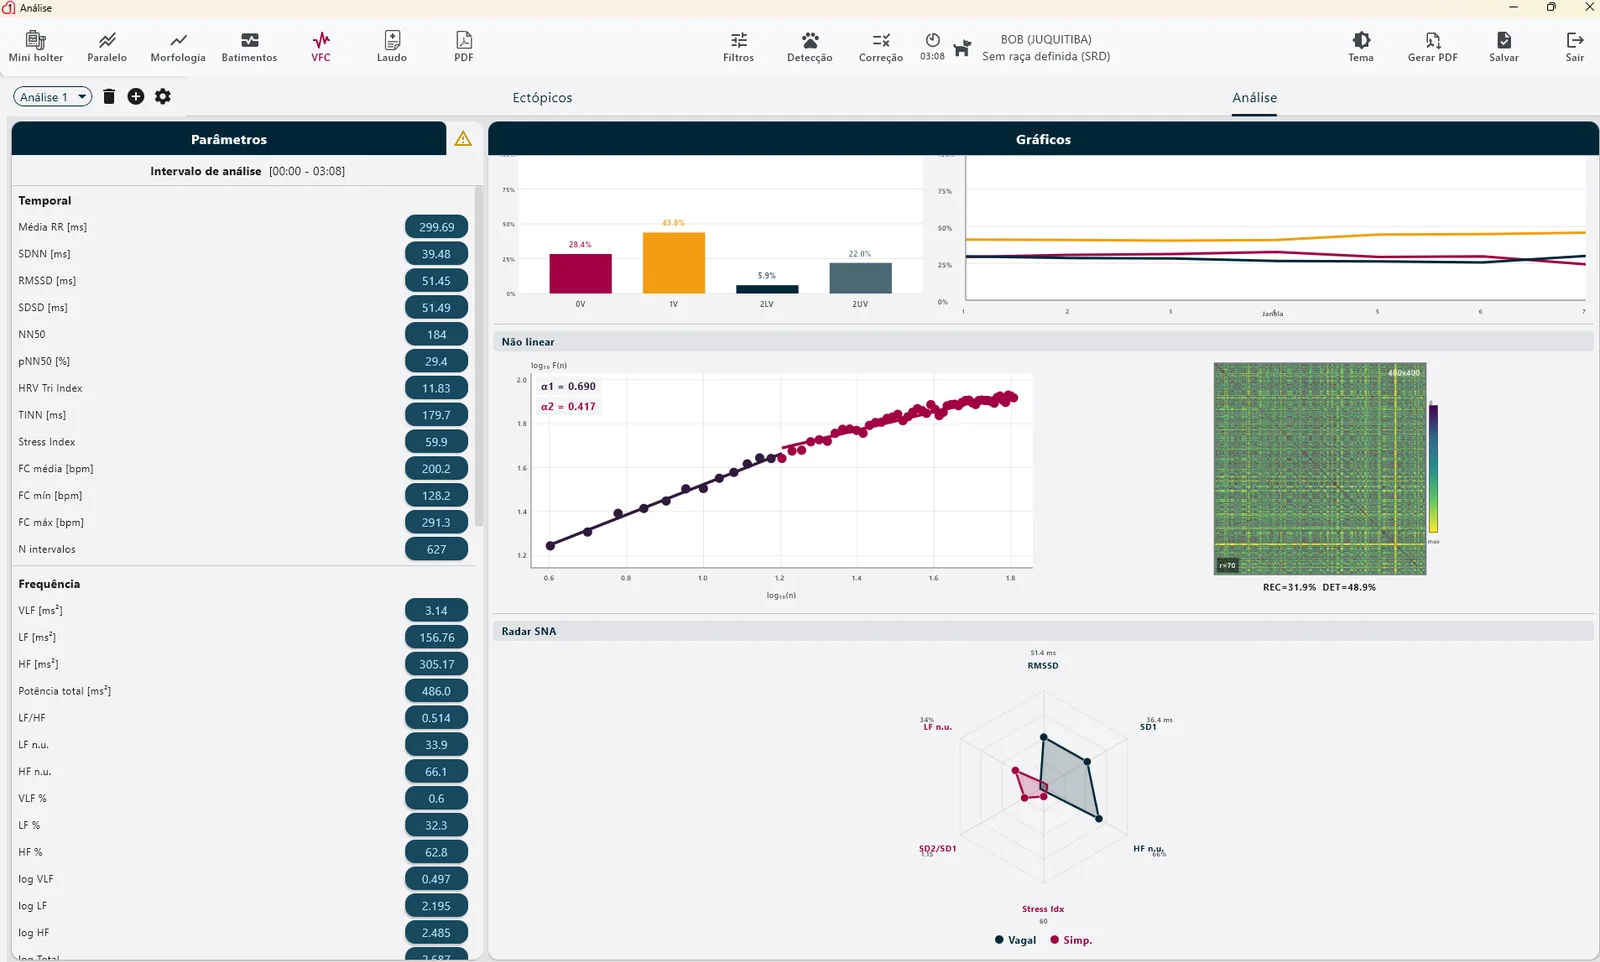
- HRV analysis HRV chart with Lorenz/Poincaré and histogram; SDNN, RMSSD and the balance between sympathetic and parasympathetic tone, computed from the tracing itself.
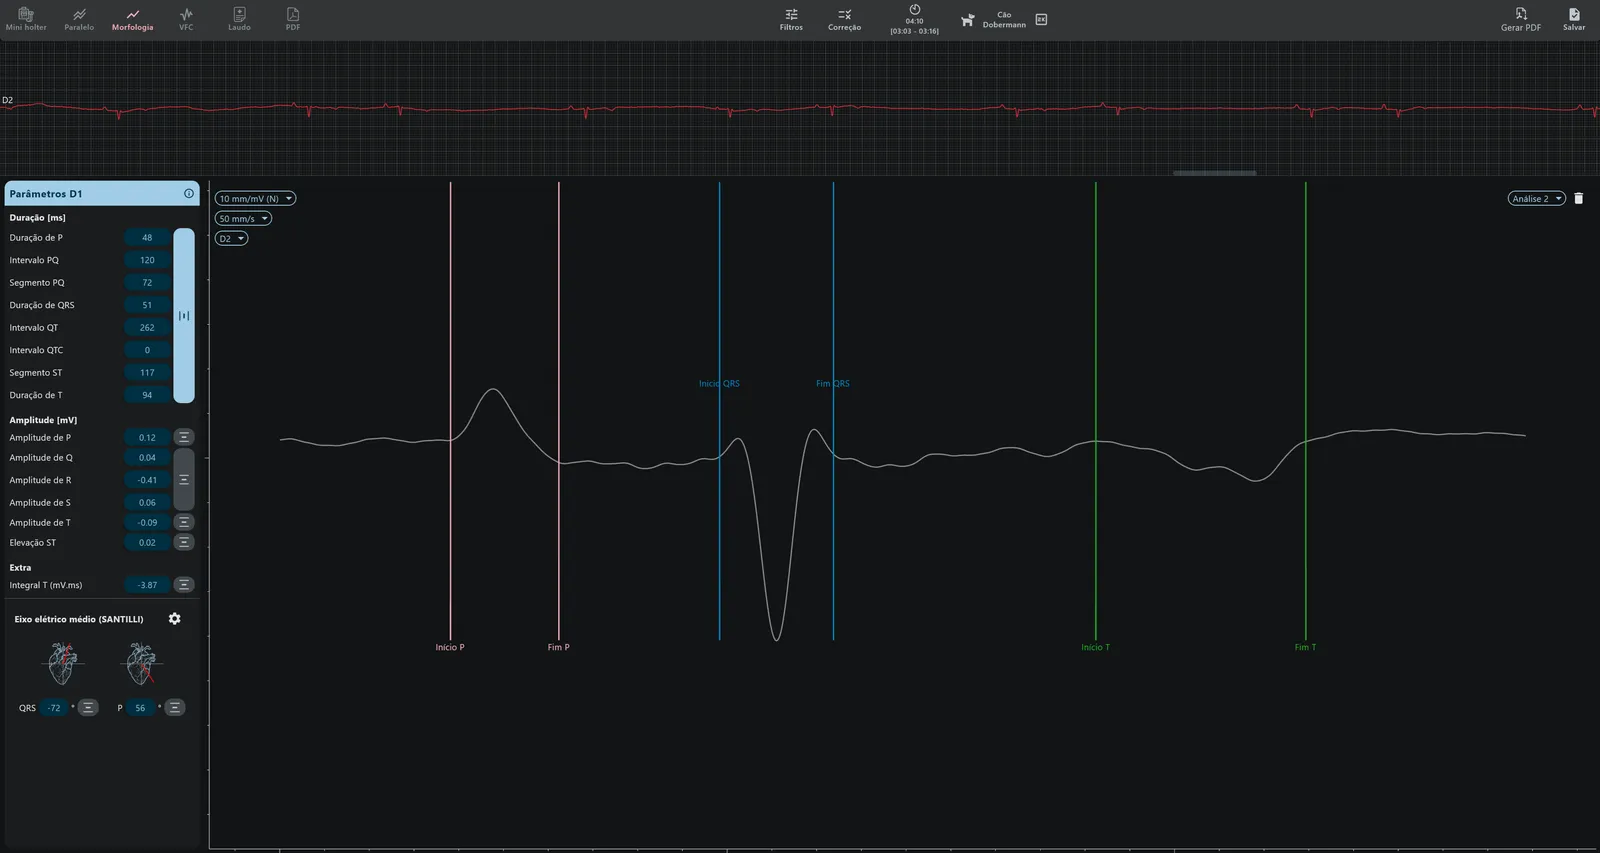
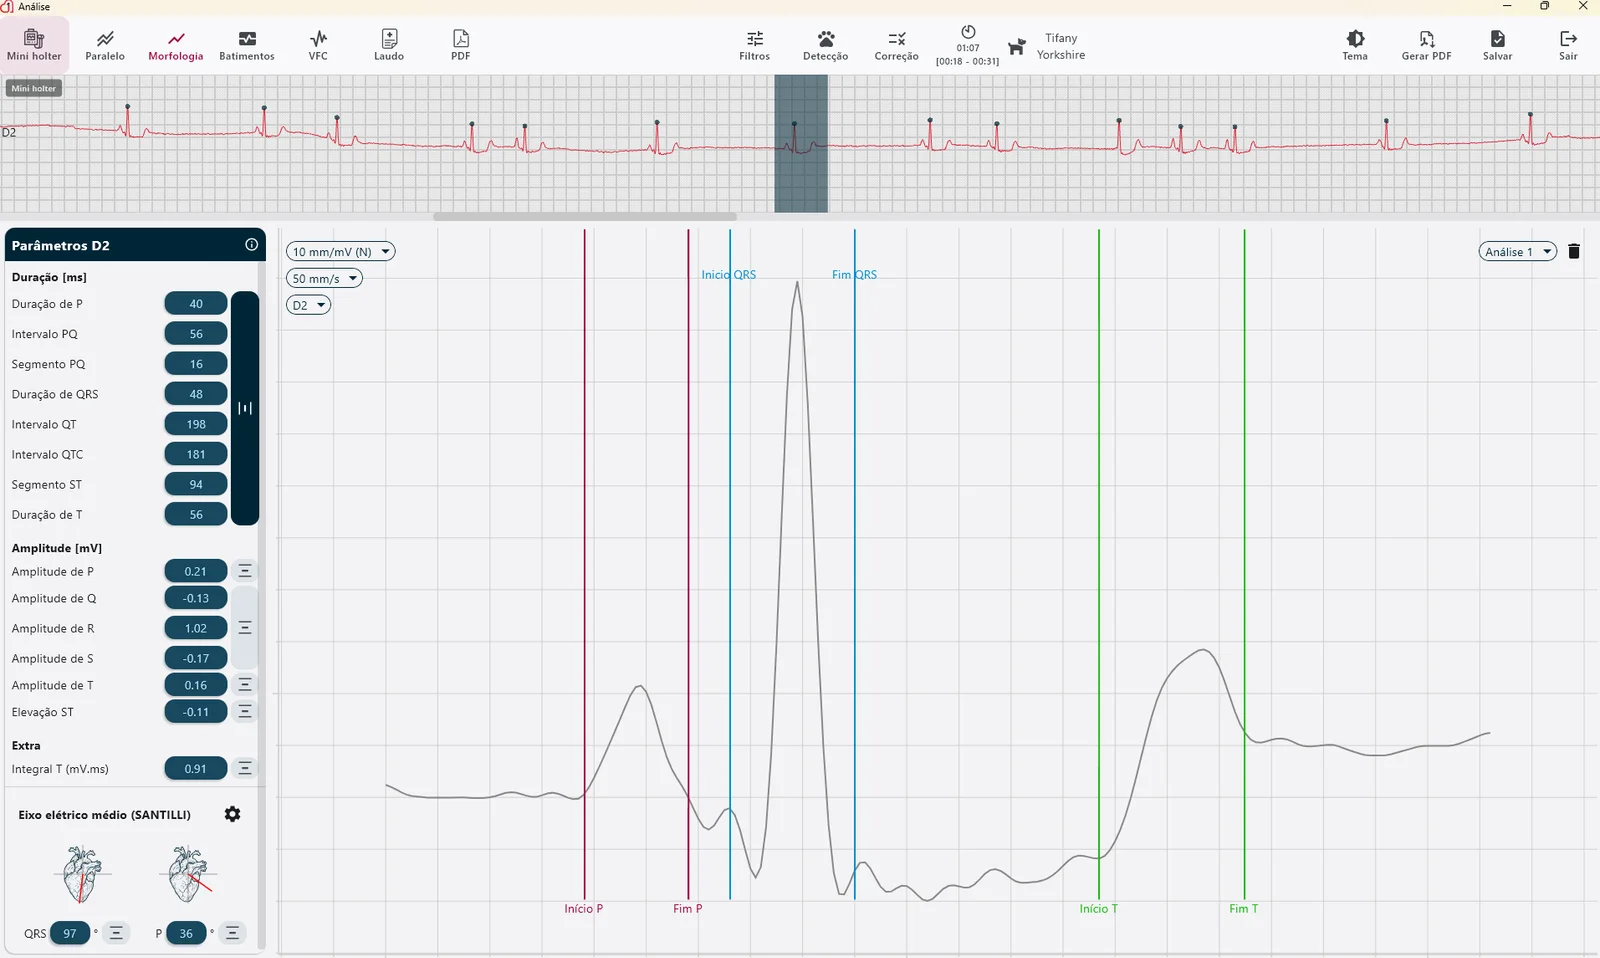
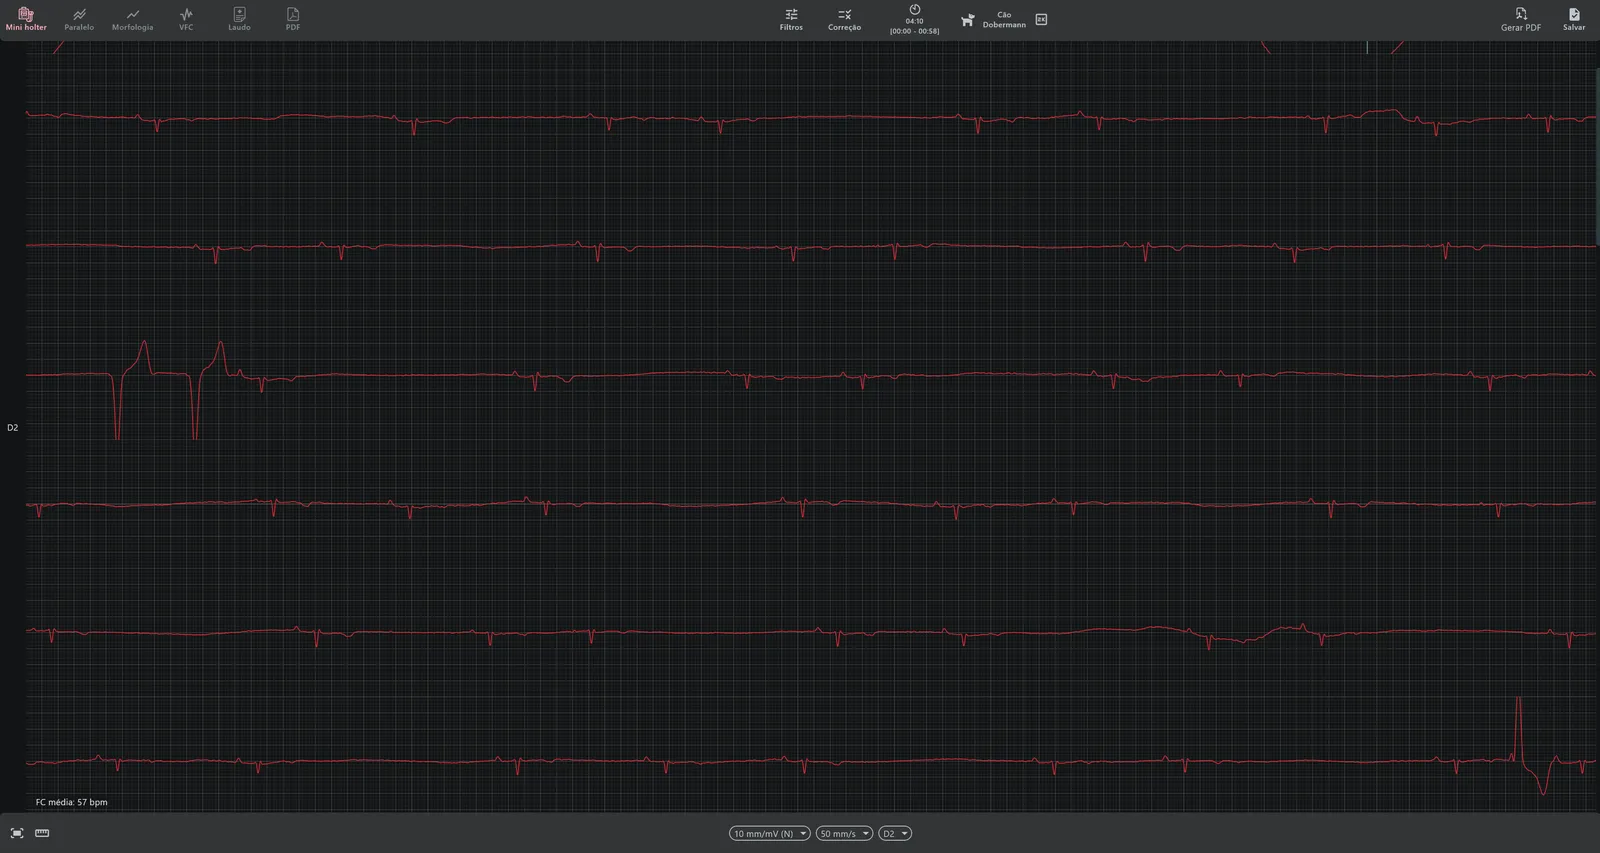
- Morphology and axis Durations, amplitudes and the electrical axis by the Santilli method, with a mini-holter and measurements taken over the tracing, lead by lead.
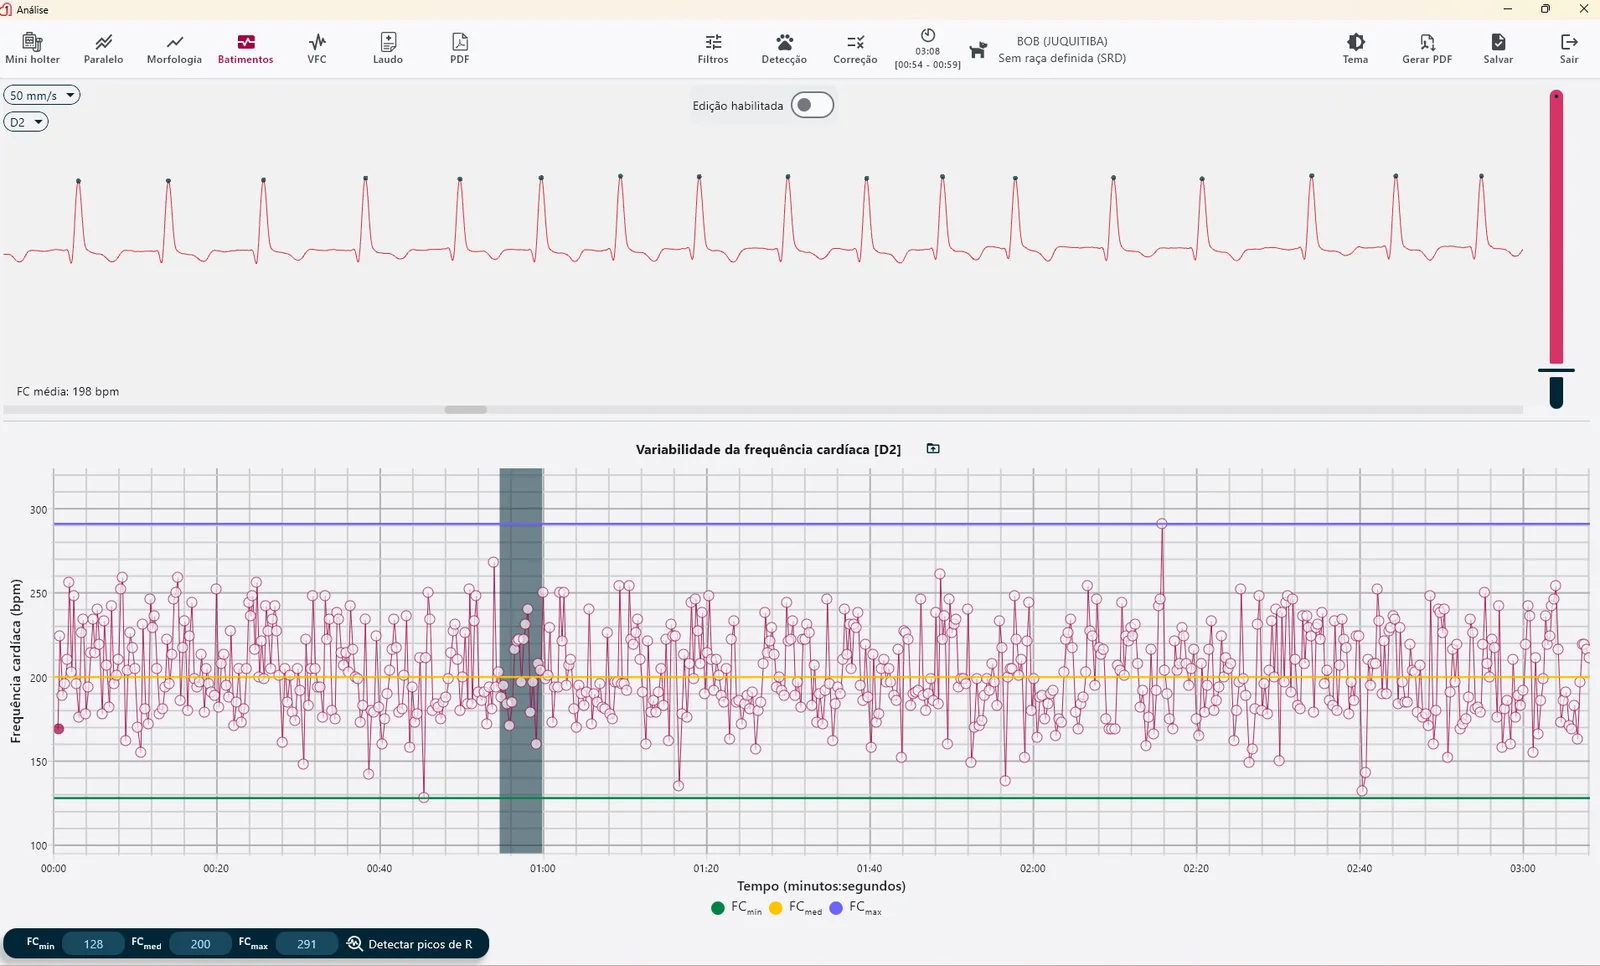
- Continuous tracing Full disclosure records the whole exam (up to 12 simultaneous leads, 24-bit, 500 Hz to 4 kHz); you pick as many segments as you want for the same report.
- PDF report Report ready to print or share, assembled with a phrase bank and your clinic's details on the page.
- Cloud and tele-reporting Every exam uploads to INcloud linked to the patient record, and can go, with one click, to a partner cardiologist's remote report.
The software up close
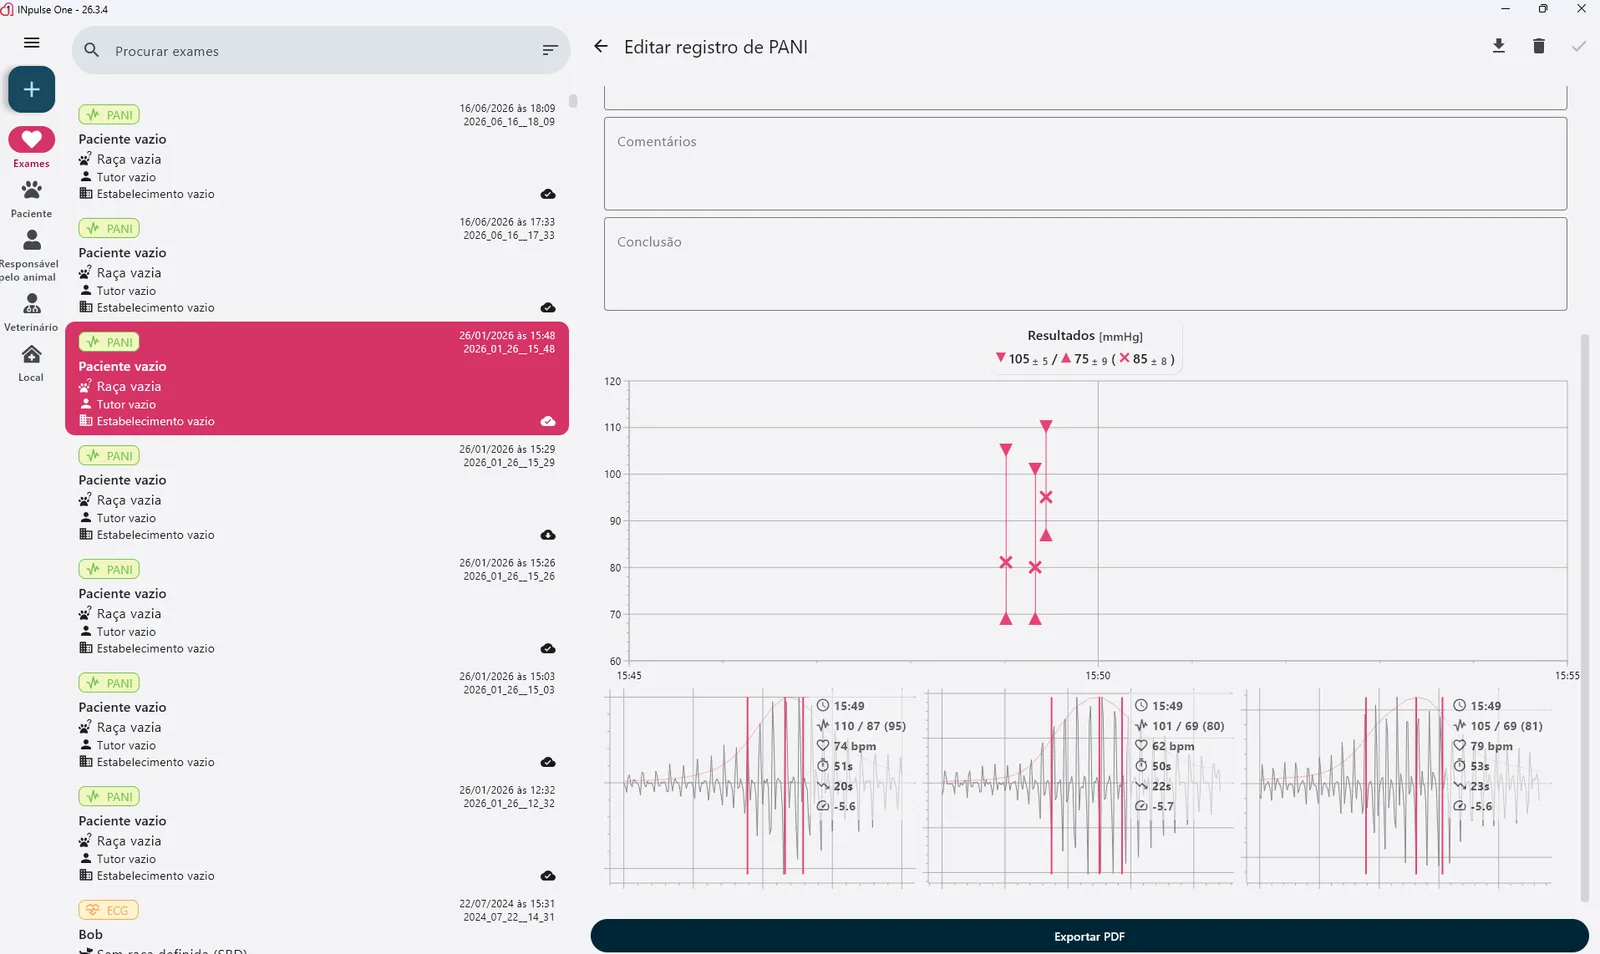
Real INpulse One screens · demo data